
News for everyone, delivered to everyone
Roughly 1 in 4 fatal car crashes in the United States happens at an intersection, according to data from the National Highway Transit Safety Administration — a figure that speaks to the delicate balancing act that intersections require, often involving vehicles on smaller, slower roads entering or crossing larger, faster thoroughfares.
The law firm of Piasta Walker Hagenbush LLC analyzed over 18 years of crash reporting data from the National Highway Traffic Safety Administration's Fatality Analysis Reporting System and found more than 142,000 fatal crashes at 136,000 intersections.
However, with nearly 16 million intersections in the continental U.S., that number means fatal crashes happened at less than 0.9% of all intersections. That shrinks to 0.04% of intersections with two or more fatal crashes, and less than 0.01% that have seen enough fatal crashes to qualify as "deadly intersections" — just under 900 such crossings qualify.
So where are the deadliest intersections in America, and what should drivers know about them?
In this analysis, we define a "deadly intersection" as one where at least three fatal crashes occurred from 2004 to 2021. There are 894 such intersections, which accounted for 2,940 fatal crashes and 3,293 deaths in that time period, and while they are spread all over the country, there are a few common characteristics.
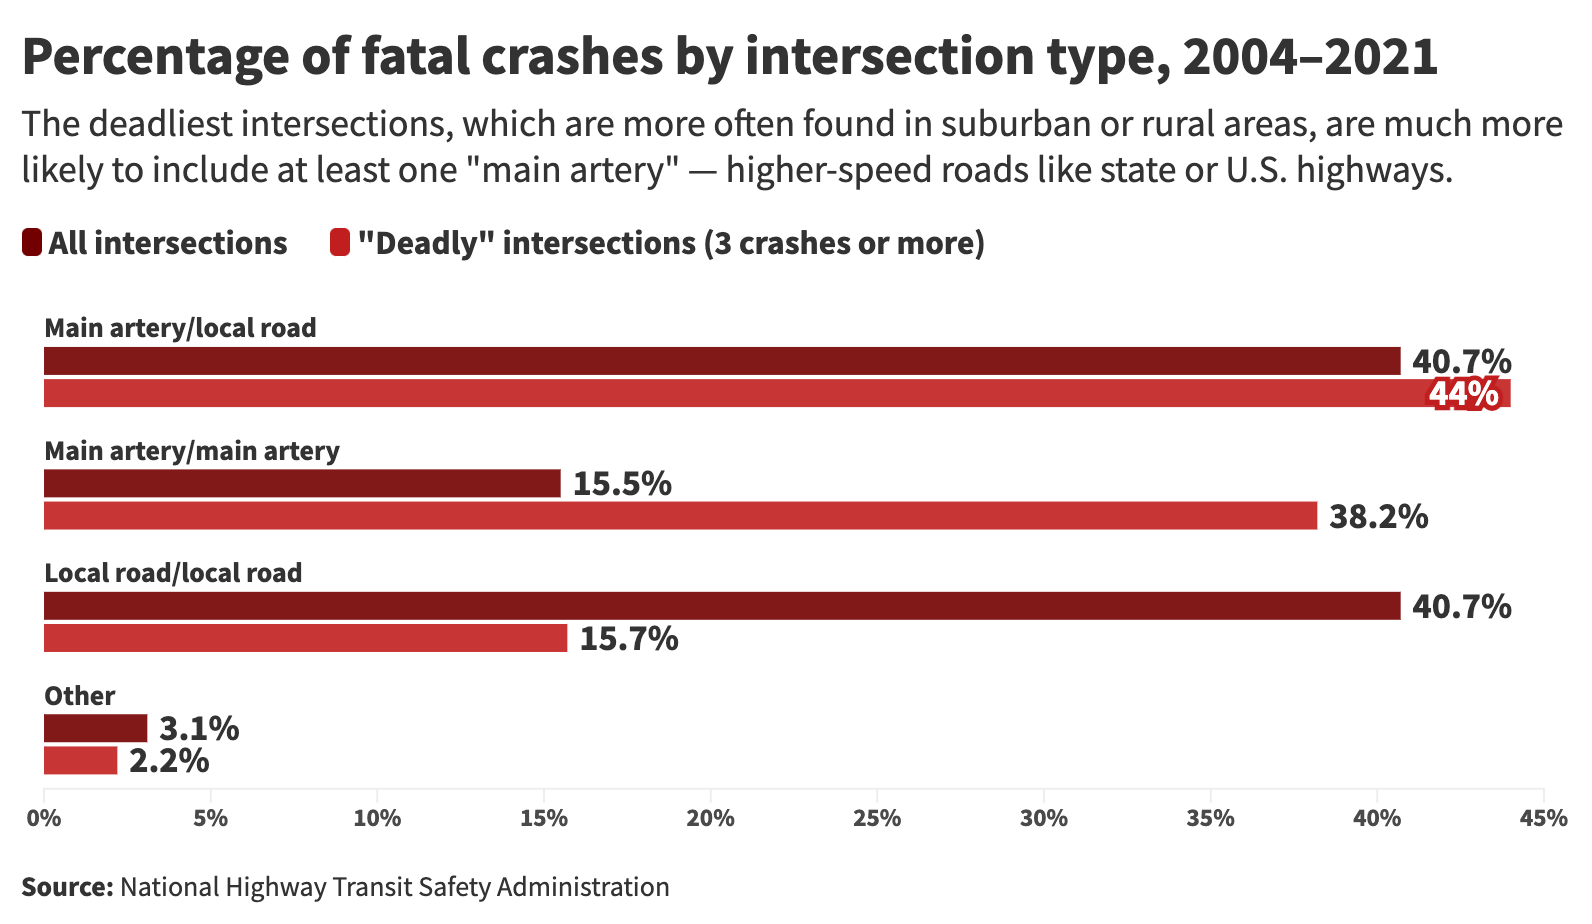
Across all intersections, main arteries — higher-speed road classes including interstates, U.S. and state highways, and county roads — are part of just over 65% of fatal crashes and 57% of deaths, either intersecting with each other or with local roadways.
But 82% of crashes and 83% of deaths at deadly intersections involve at least one main artery, also referred to as secondary roads.
In particular, fatal motor vehicle crashes at the junction of two main arteries are more than twice as common at deadly intersections, representing about 16% of crashes at all intersections but nearly 40% at deadly intersections. That increase is likely due largely to increased speed on major roadways.
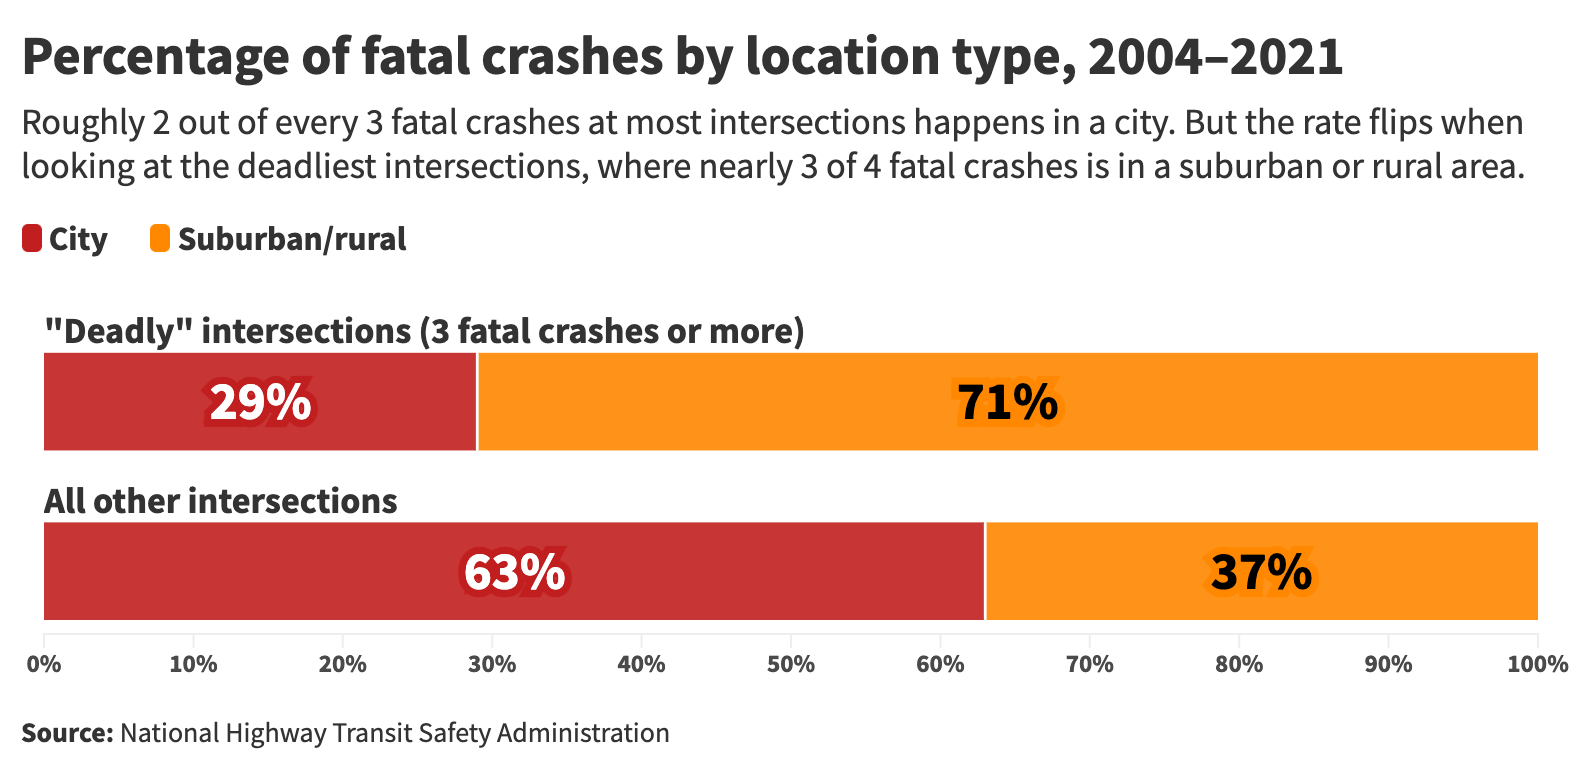
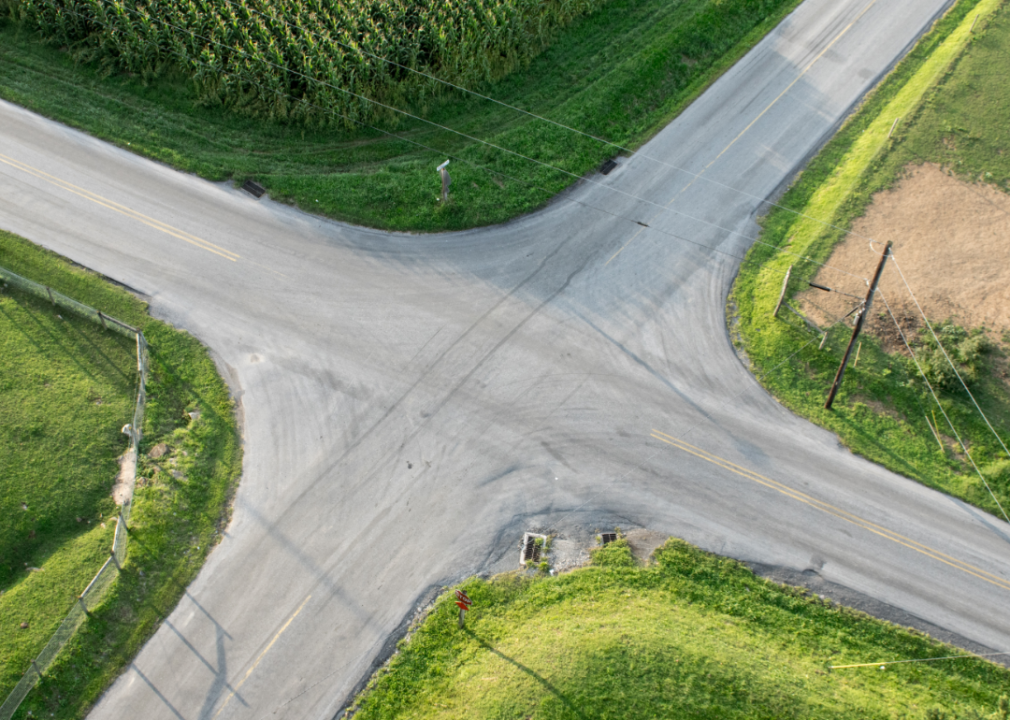
Over 60% of fatal crashes at intersections with fewer than 3 crashes happened in cities. But outside of city limits, that rate inverts — 71% of the fatal crashes at deadly intersections were in non-city areas
Roads in more suburban or rural areas are not always as well-lit at night as comparable roads in cities, which increases the risk that a driver approaching an intersection may not see another vehicle until it is too late to avoid a collision.
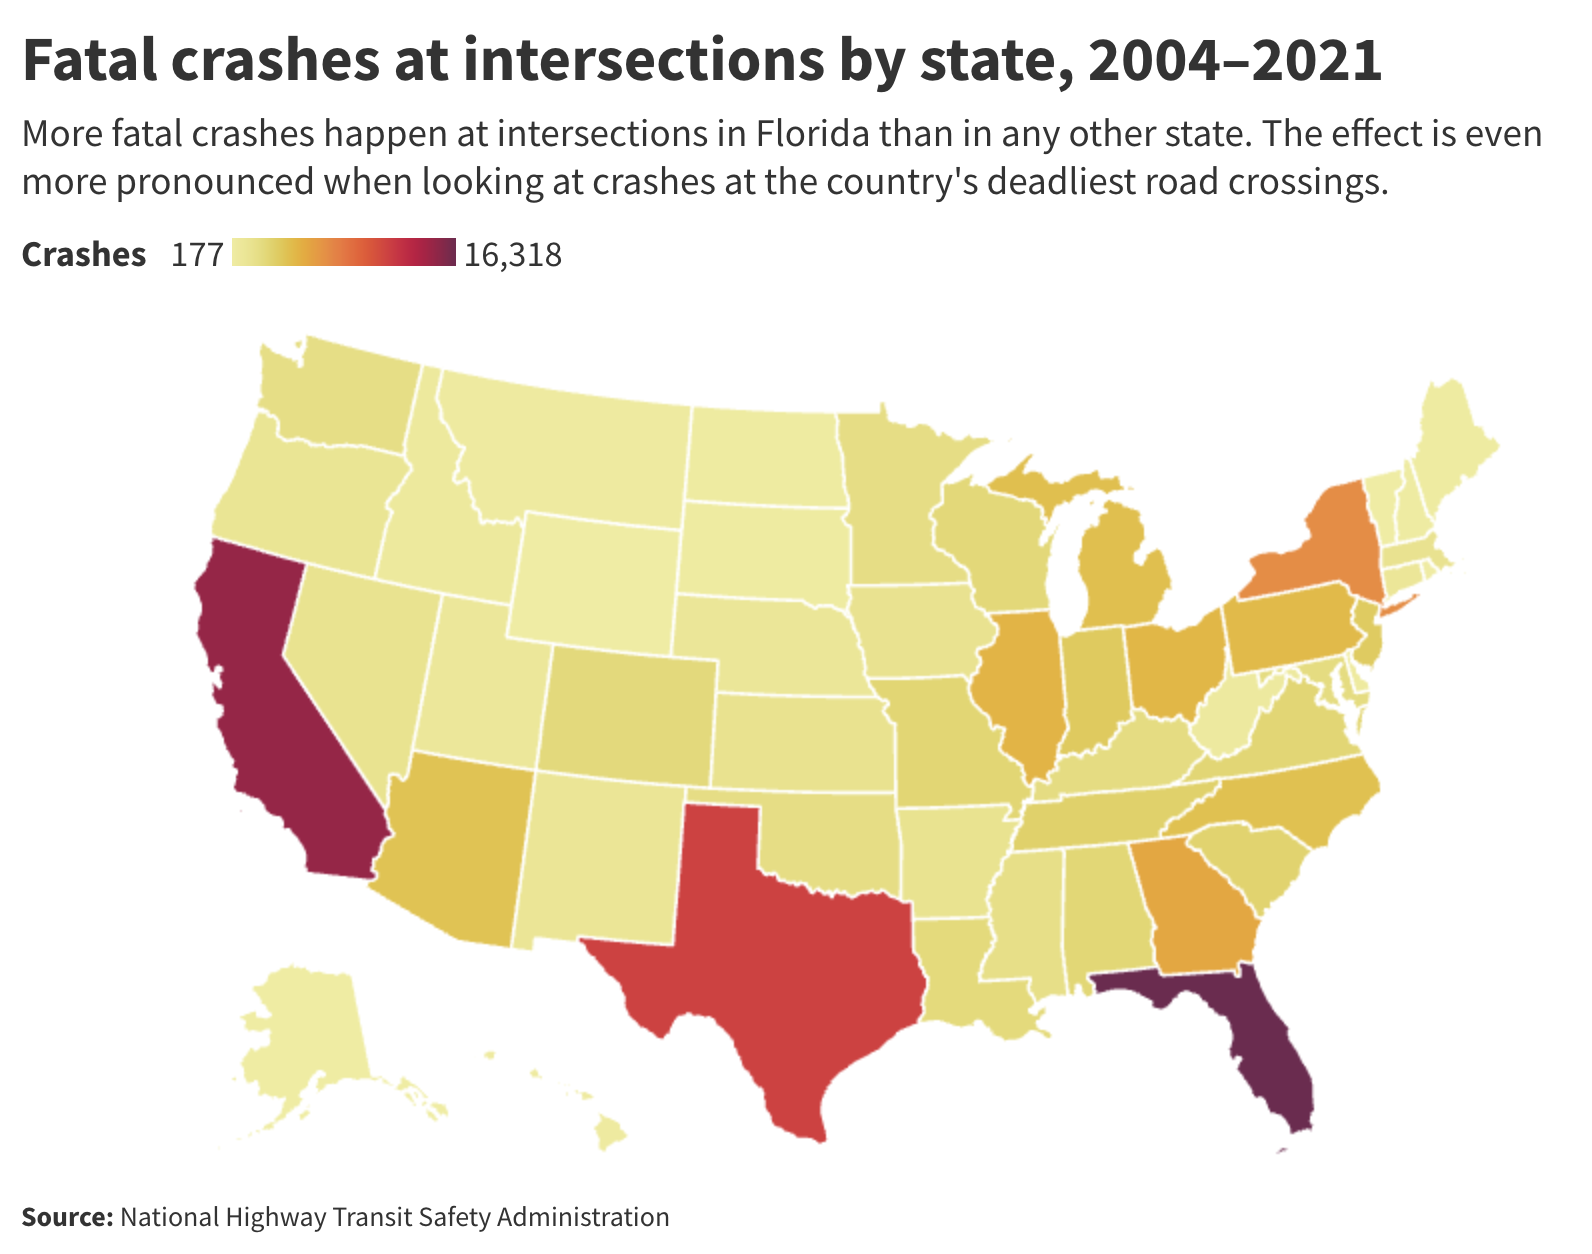
Fatal crashes at intersections happen in all 50 U.S. states and the District of Columbia. In fact, D.C. has a higher proportion of fatal crashes happening at road crossings (46%) than any other state.
But if you're trying to determine the capital of intersection crashes in the U.S., look no further than Florida. The Sunshine State is #1 in fatal crashes at all intersections and at deadly intersections, and it has more than three times as many deadly intersections (257) as the next highest state, Arizona (82).
Florida is also home to 11 of the 38 intersections that had at least five fatal crashes from 2004 to 2021. The only other states with more than two were Texas (4), Arizona (3), and South Carolina (3). However, none of the nine deadliest intersections in the country — the junctions with more than five fatal crashes — were in the state.
During the observation period, a total of 38 intersections saw at least five fatal crashes. Of those crossings, only nine were the site of more than five.
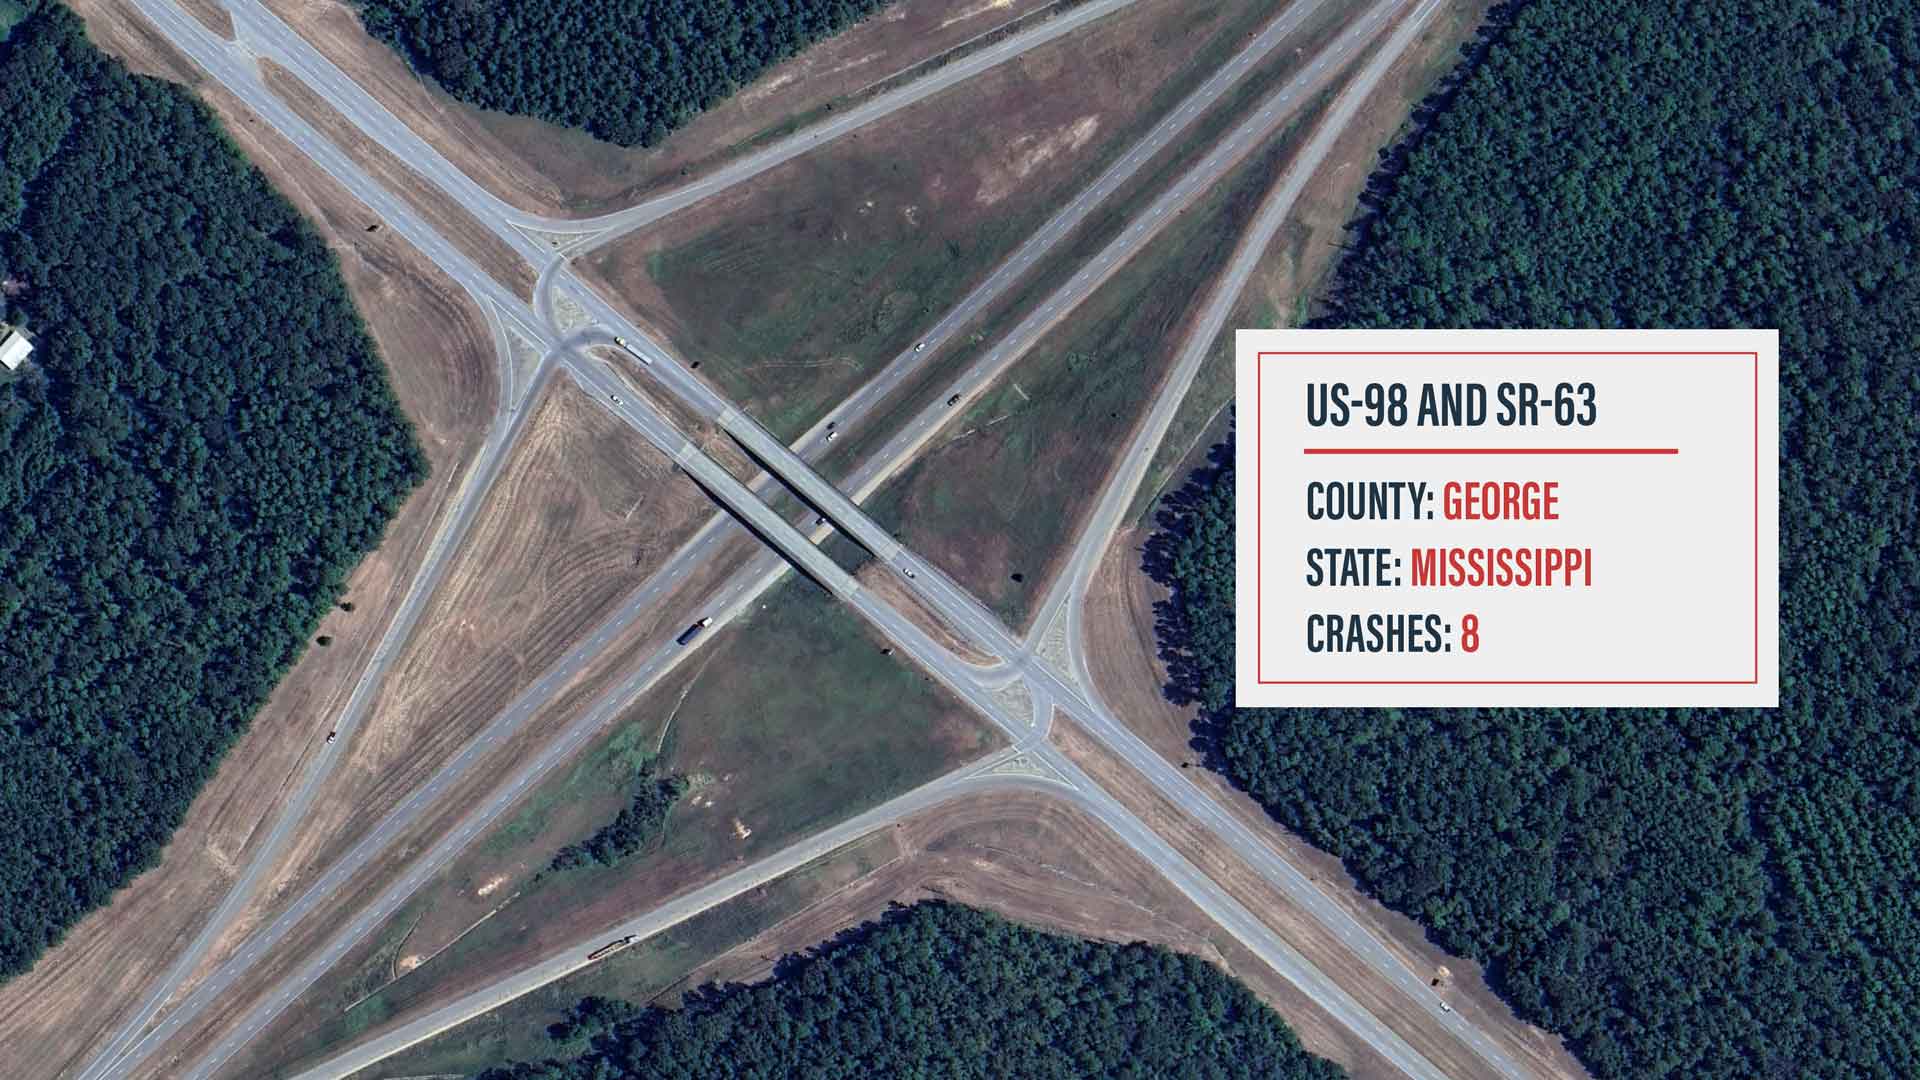
George County, Mississippi
Fatal Crashes: 8
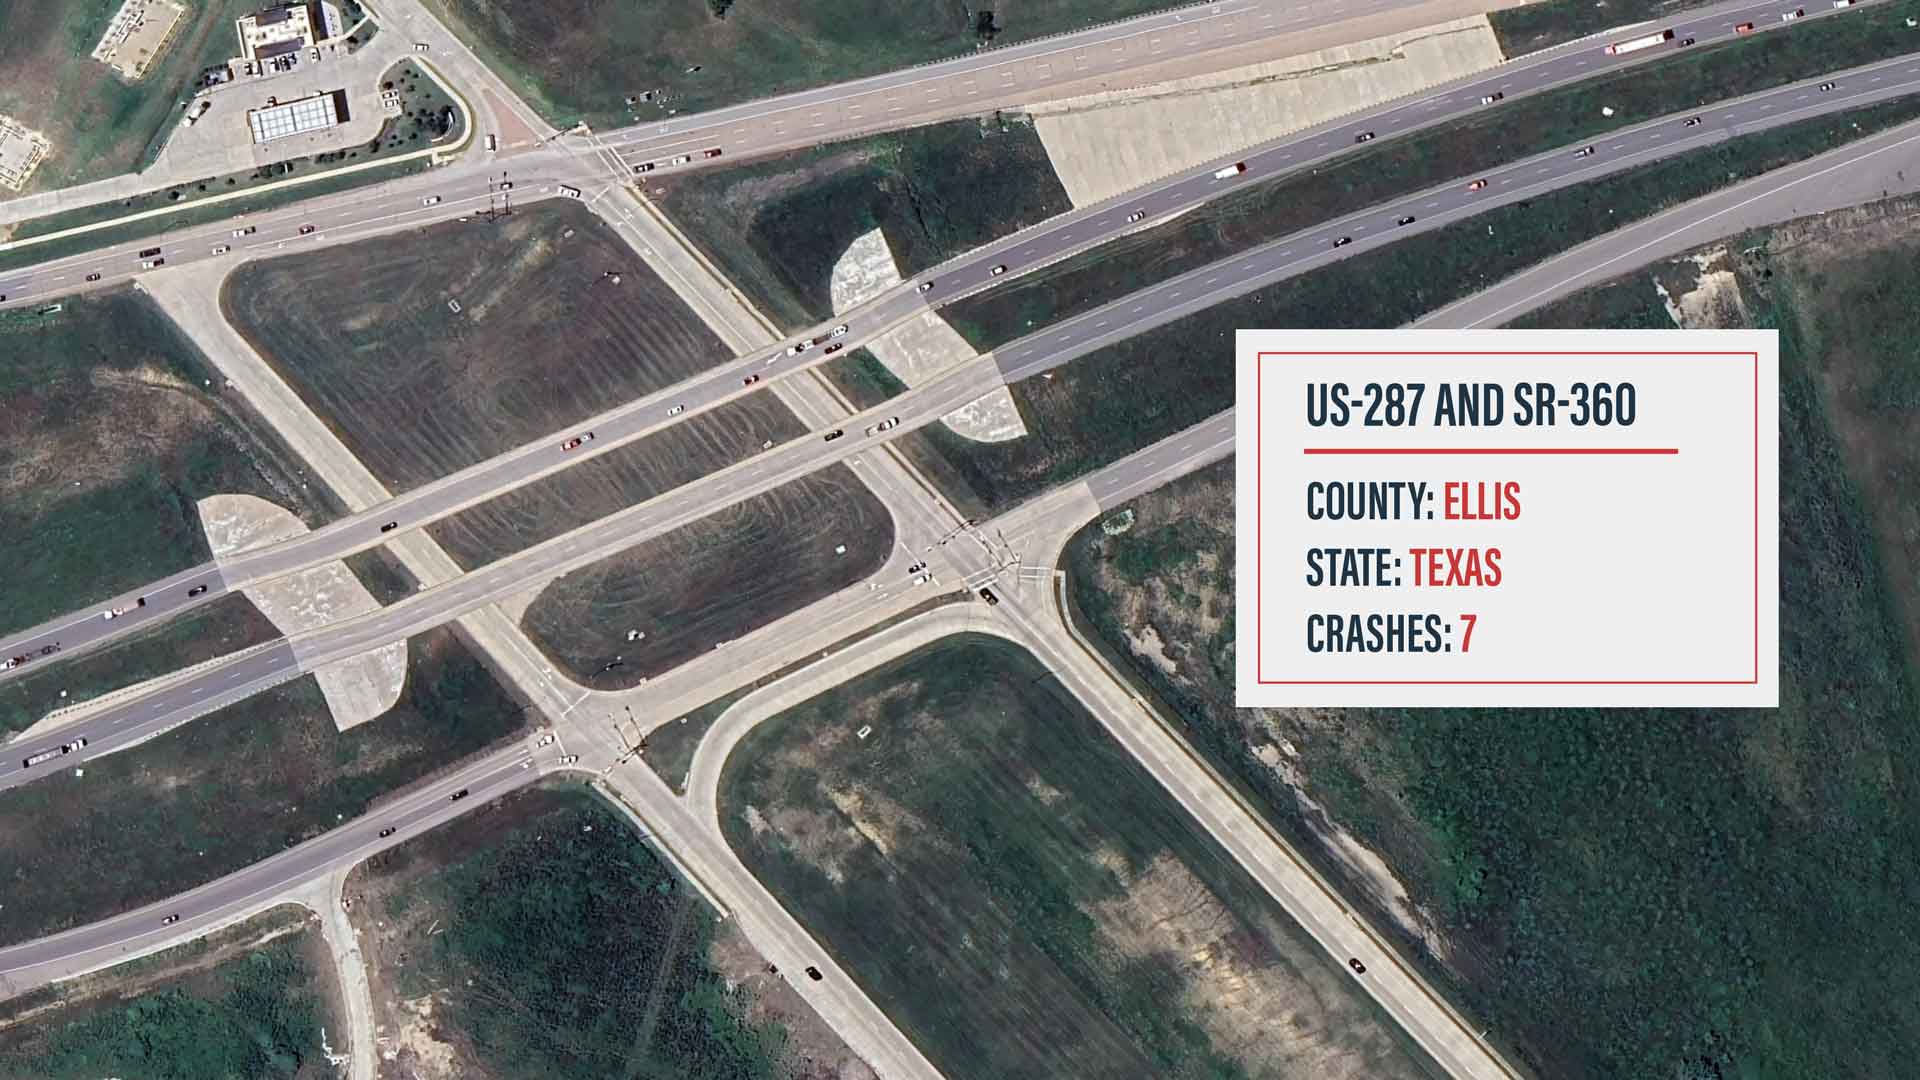
Ellis County, Texas
Fatal Crashes: 7
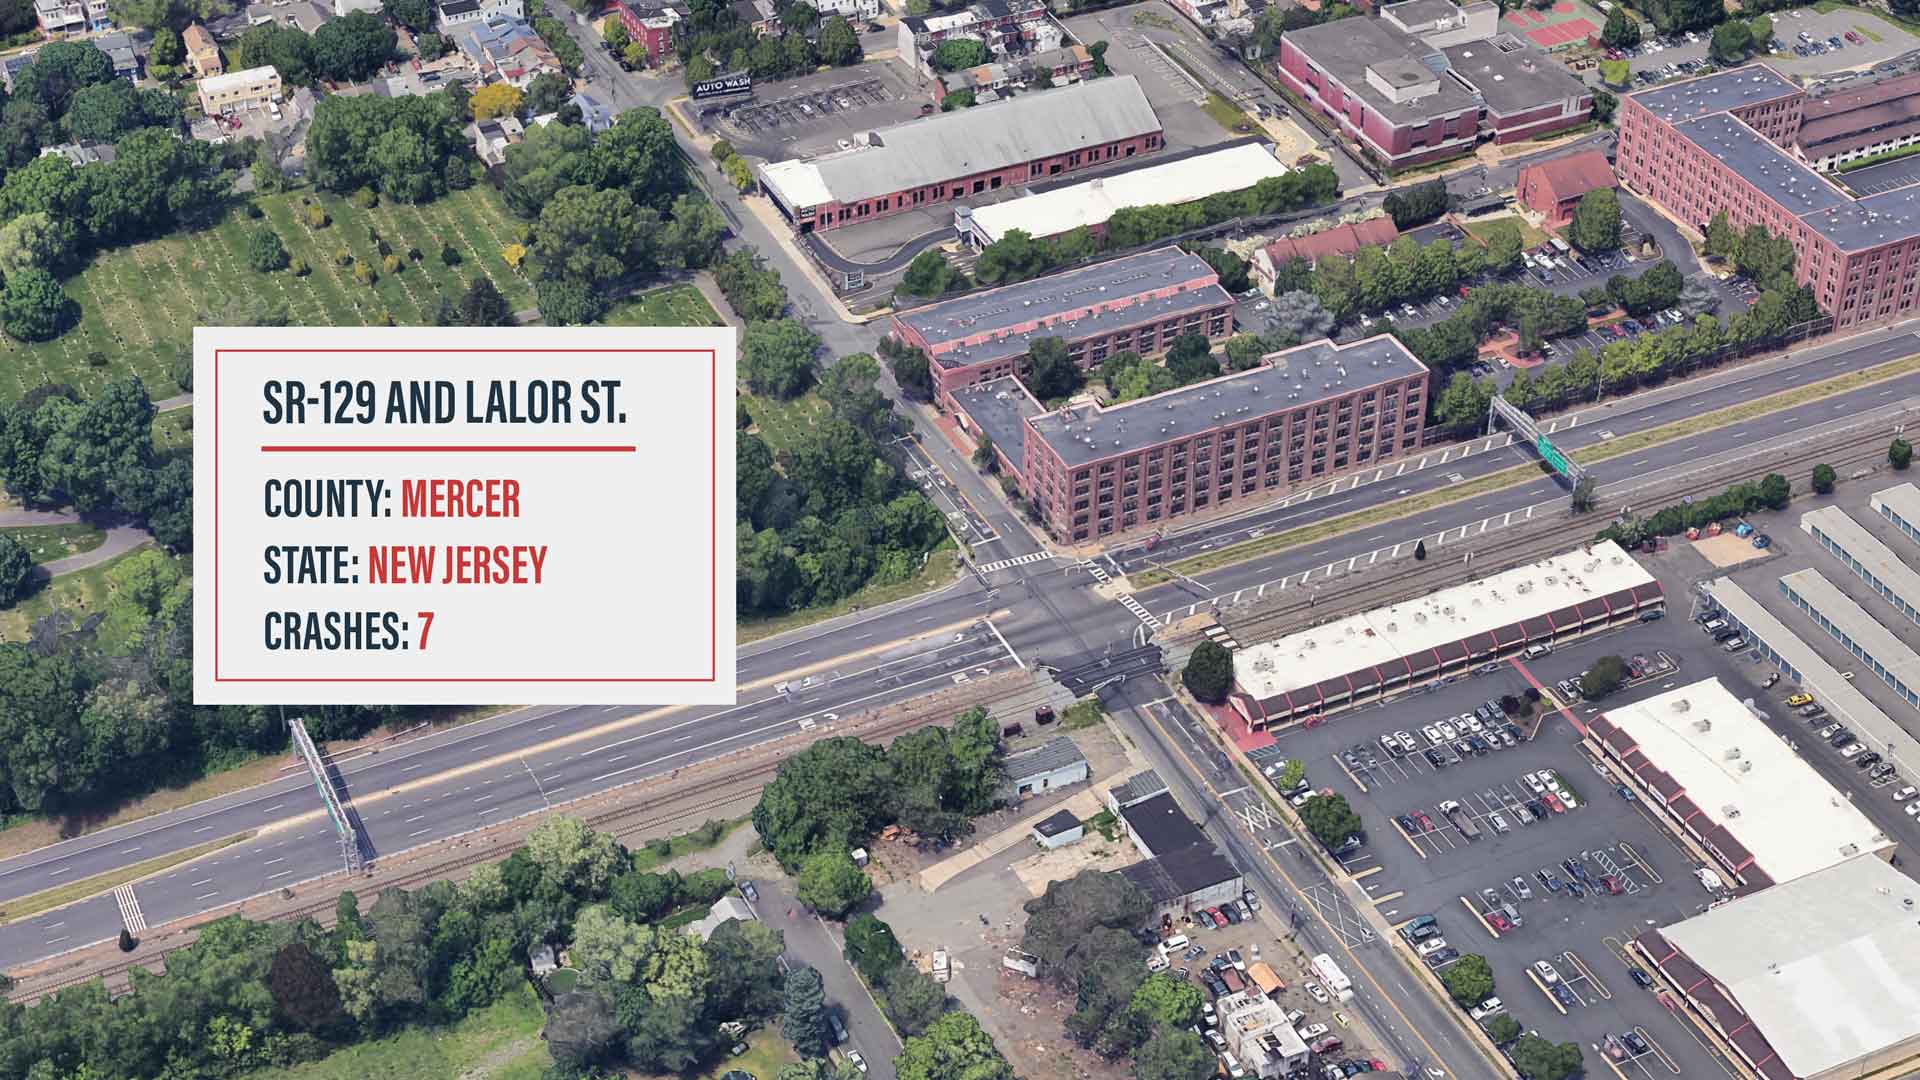
Mercer County, New Jersey
Fatal Crashes: 7
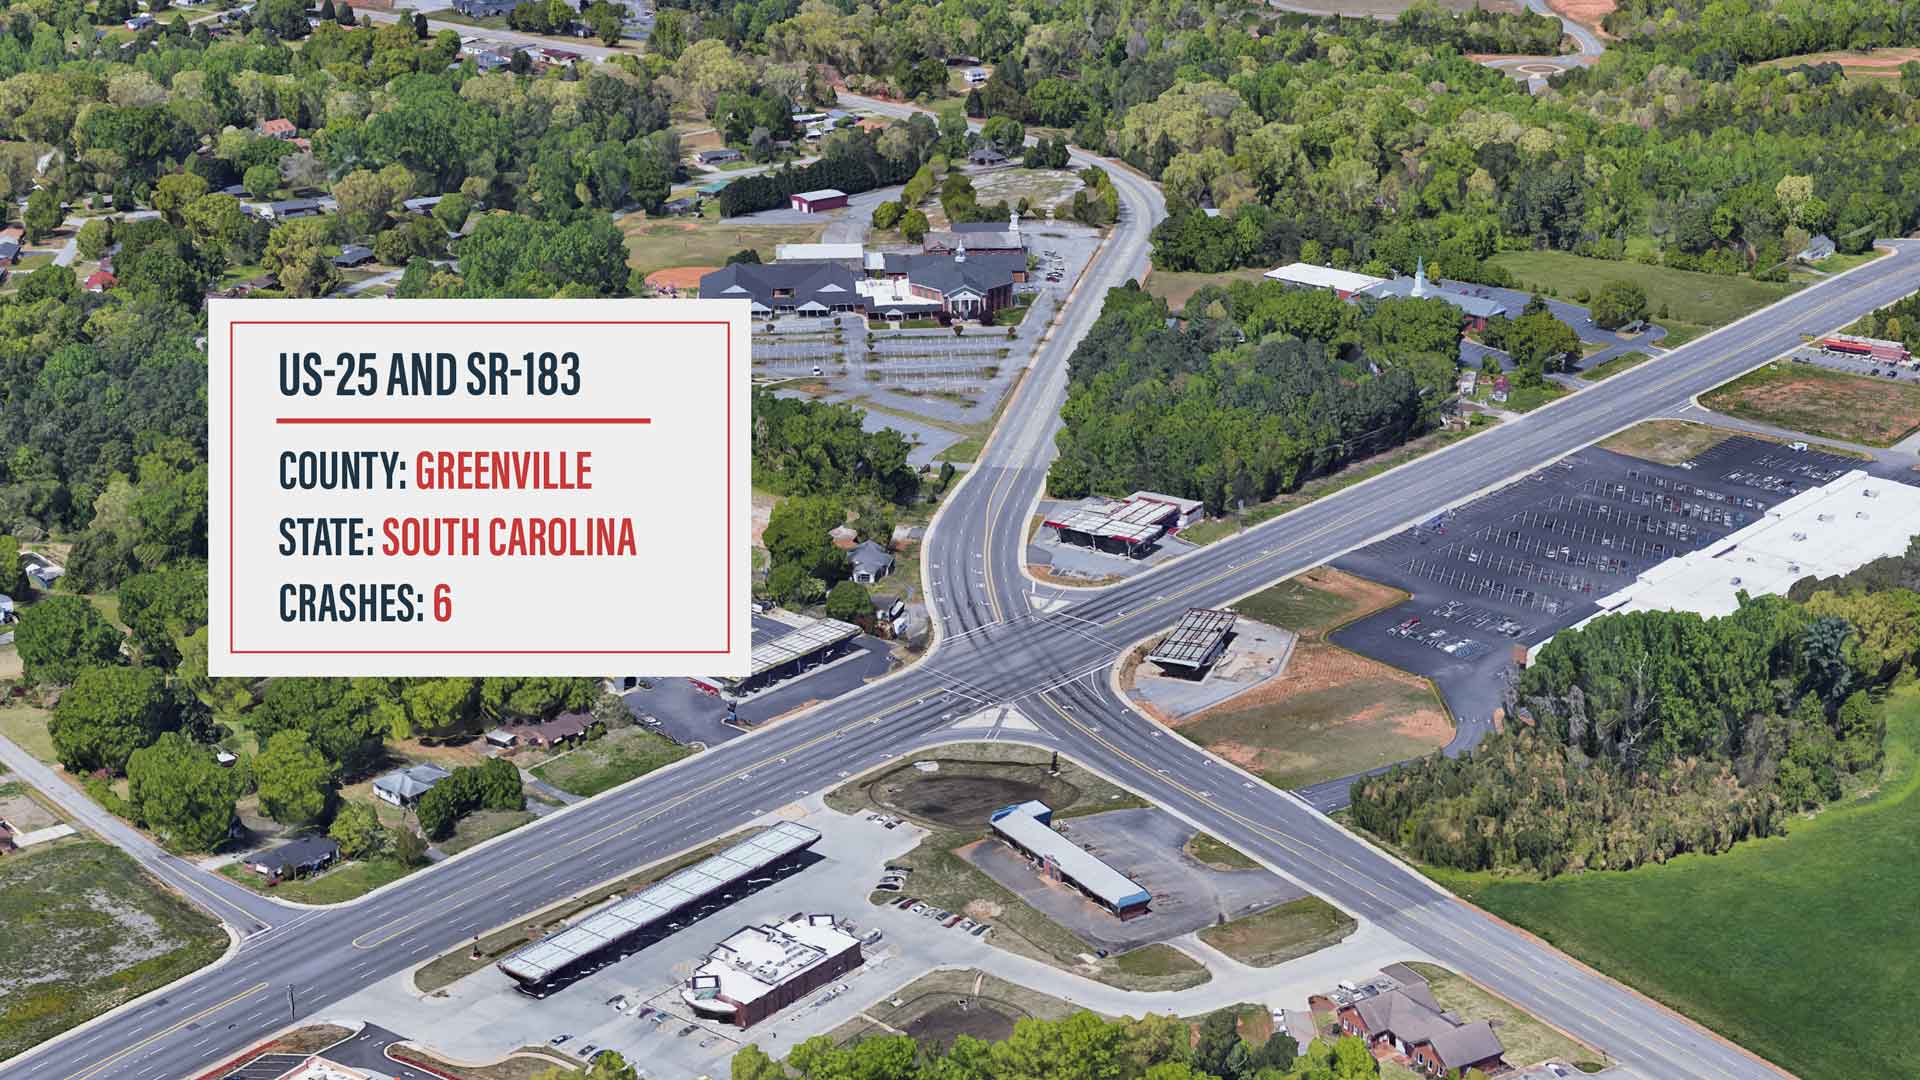
Greenville County, South Carolina
Fatal Crashes: 6

Bucks County, Pennsylvania
Fatal Crashes: 6
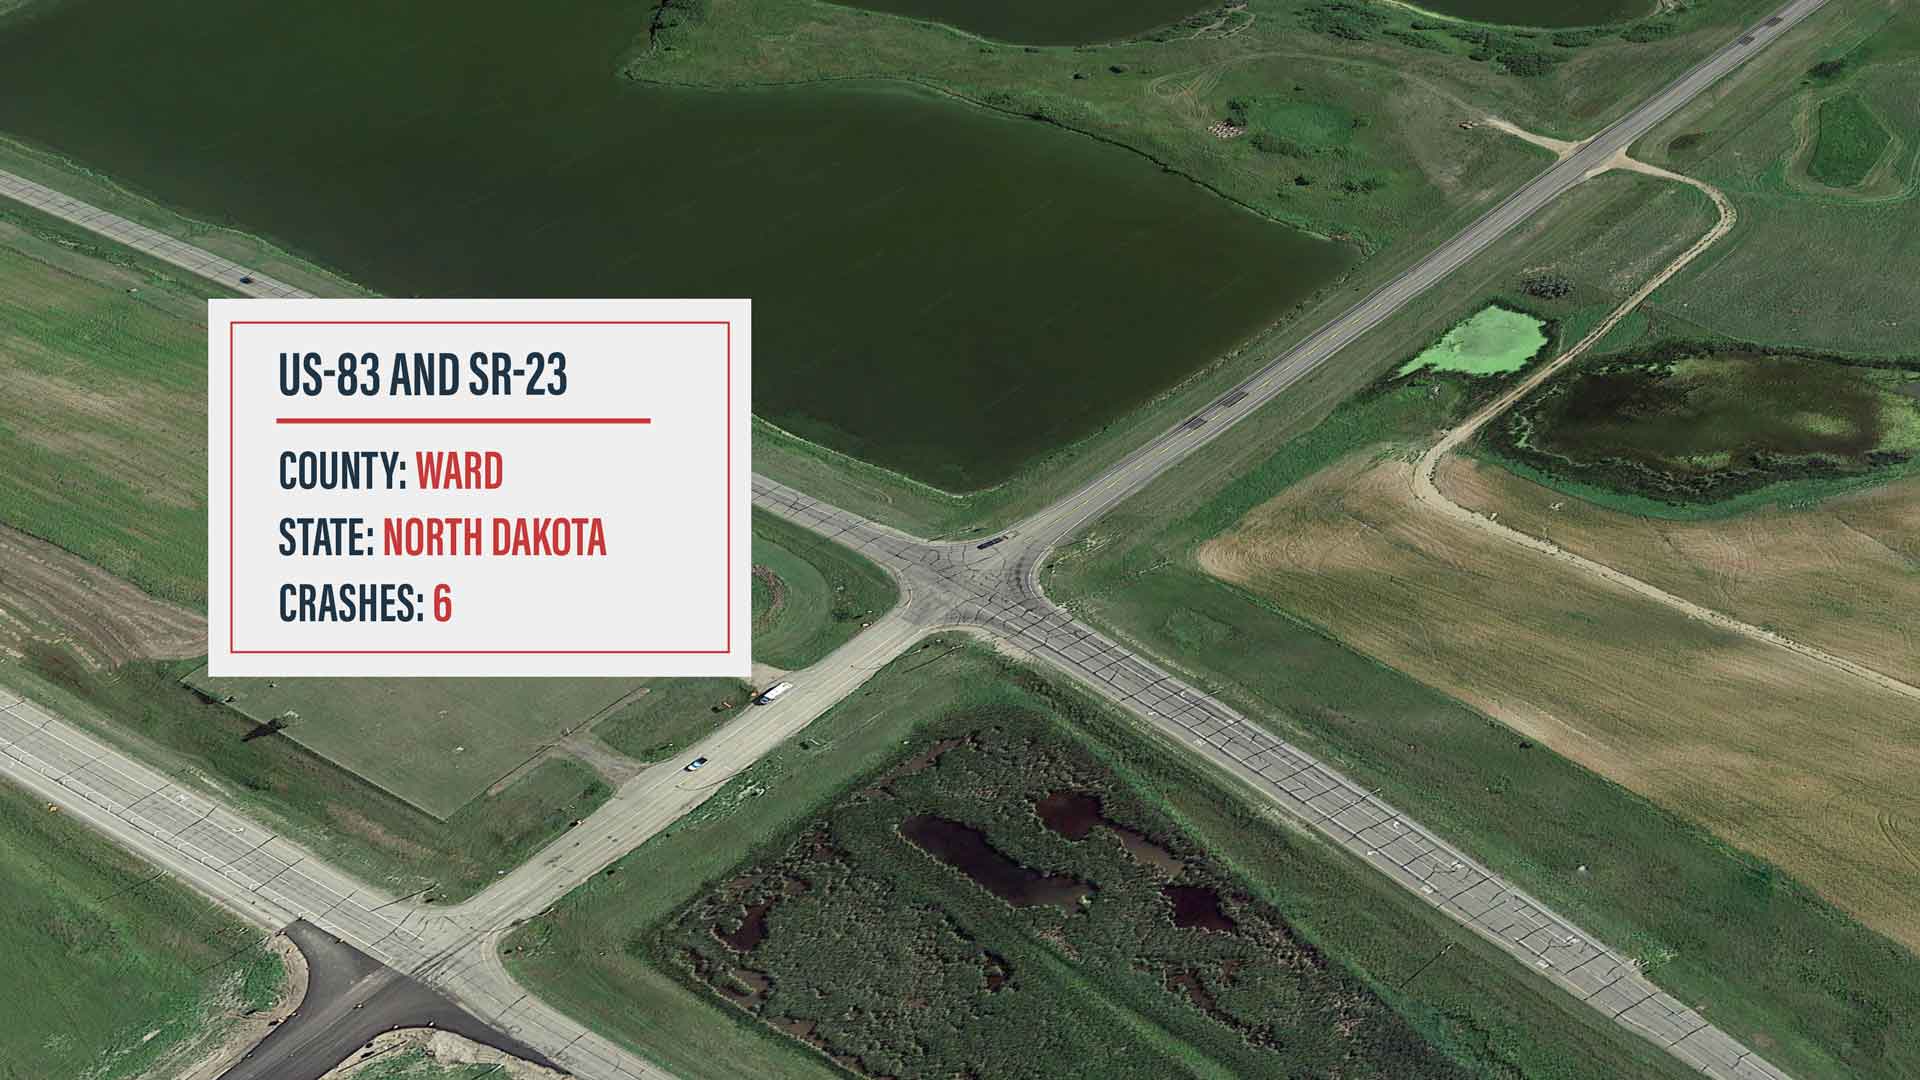
Ward County, North Dakota
Fatal Crashes: 6
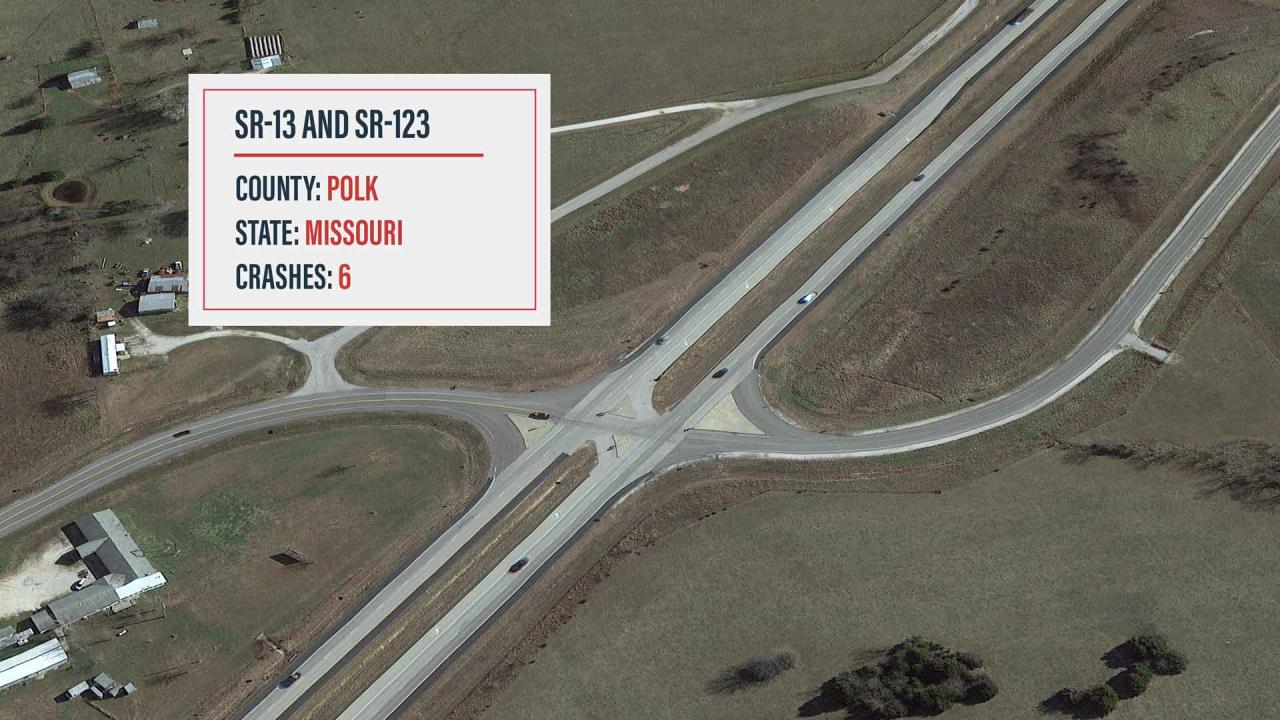
Polk County, Missouri
Fatal Crashes: 6
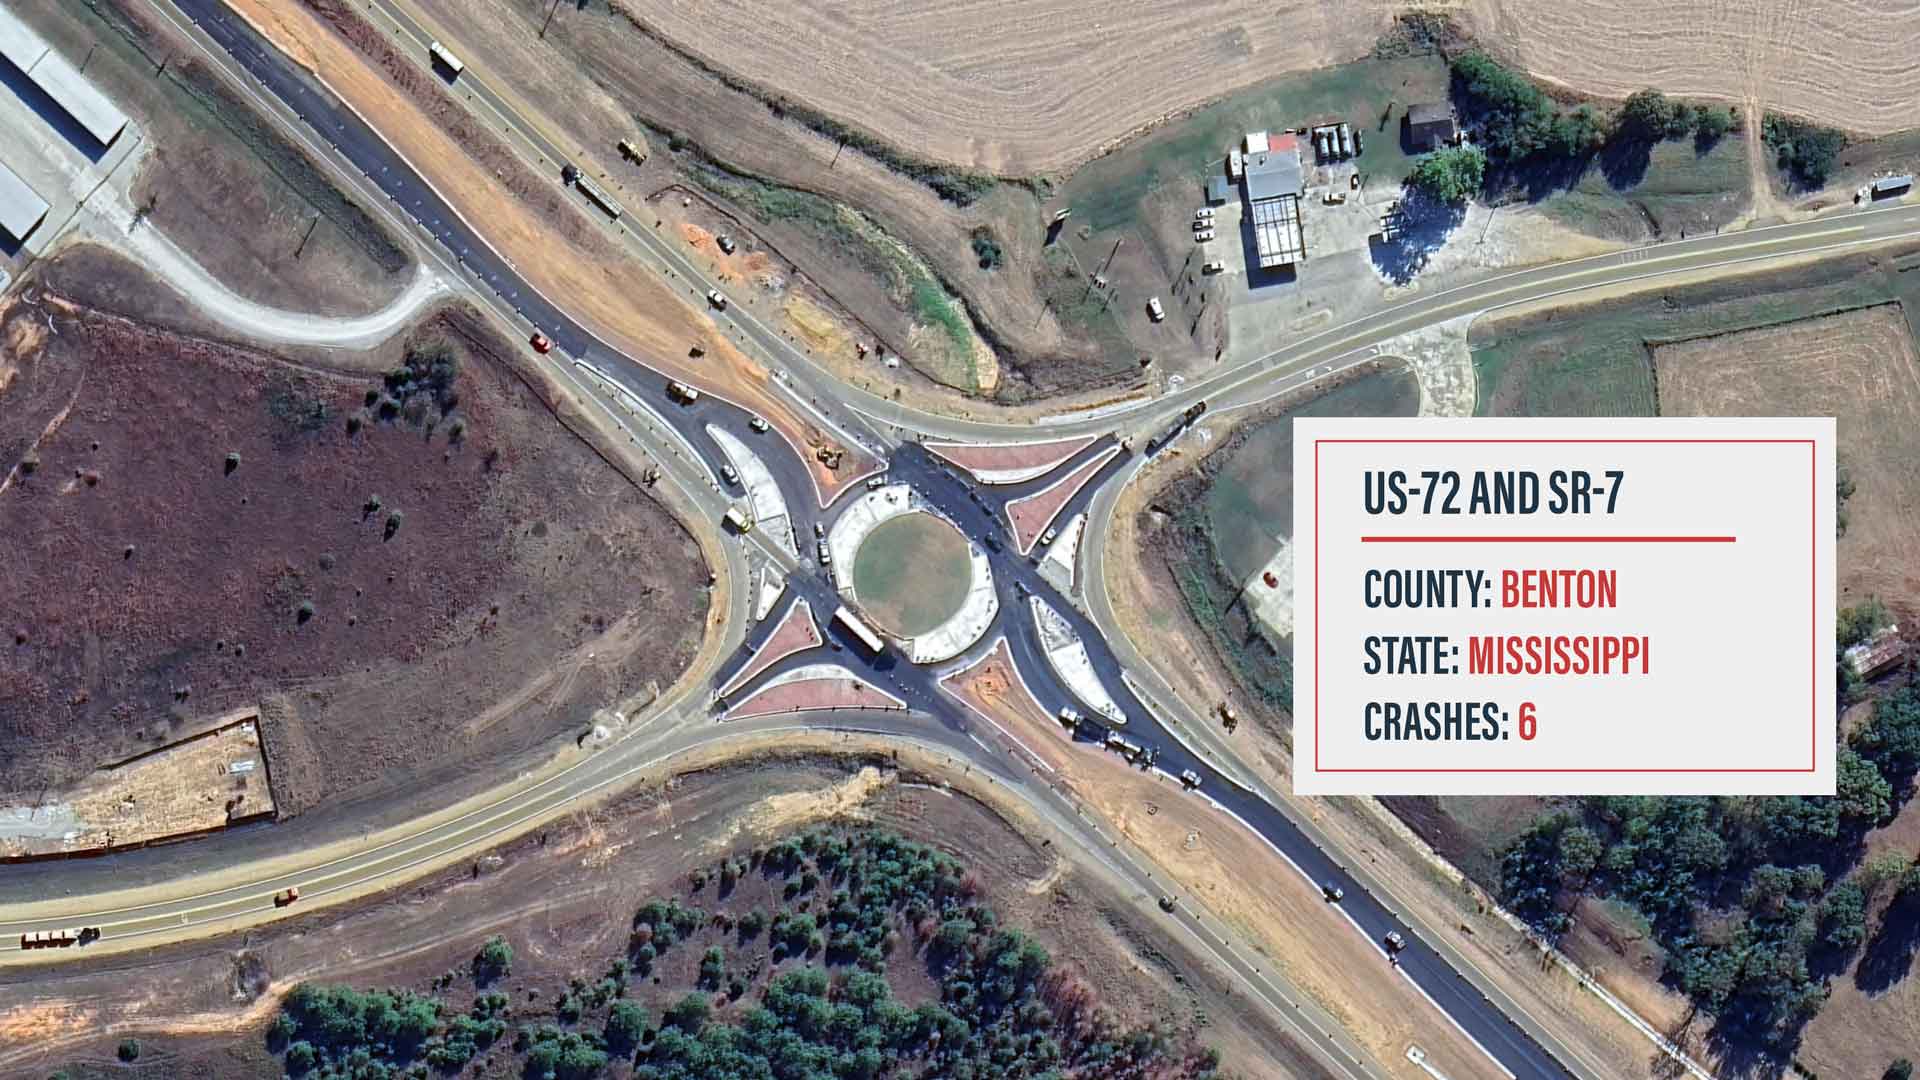
Benton County, Mississippi
Fatal Crashes: 6
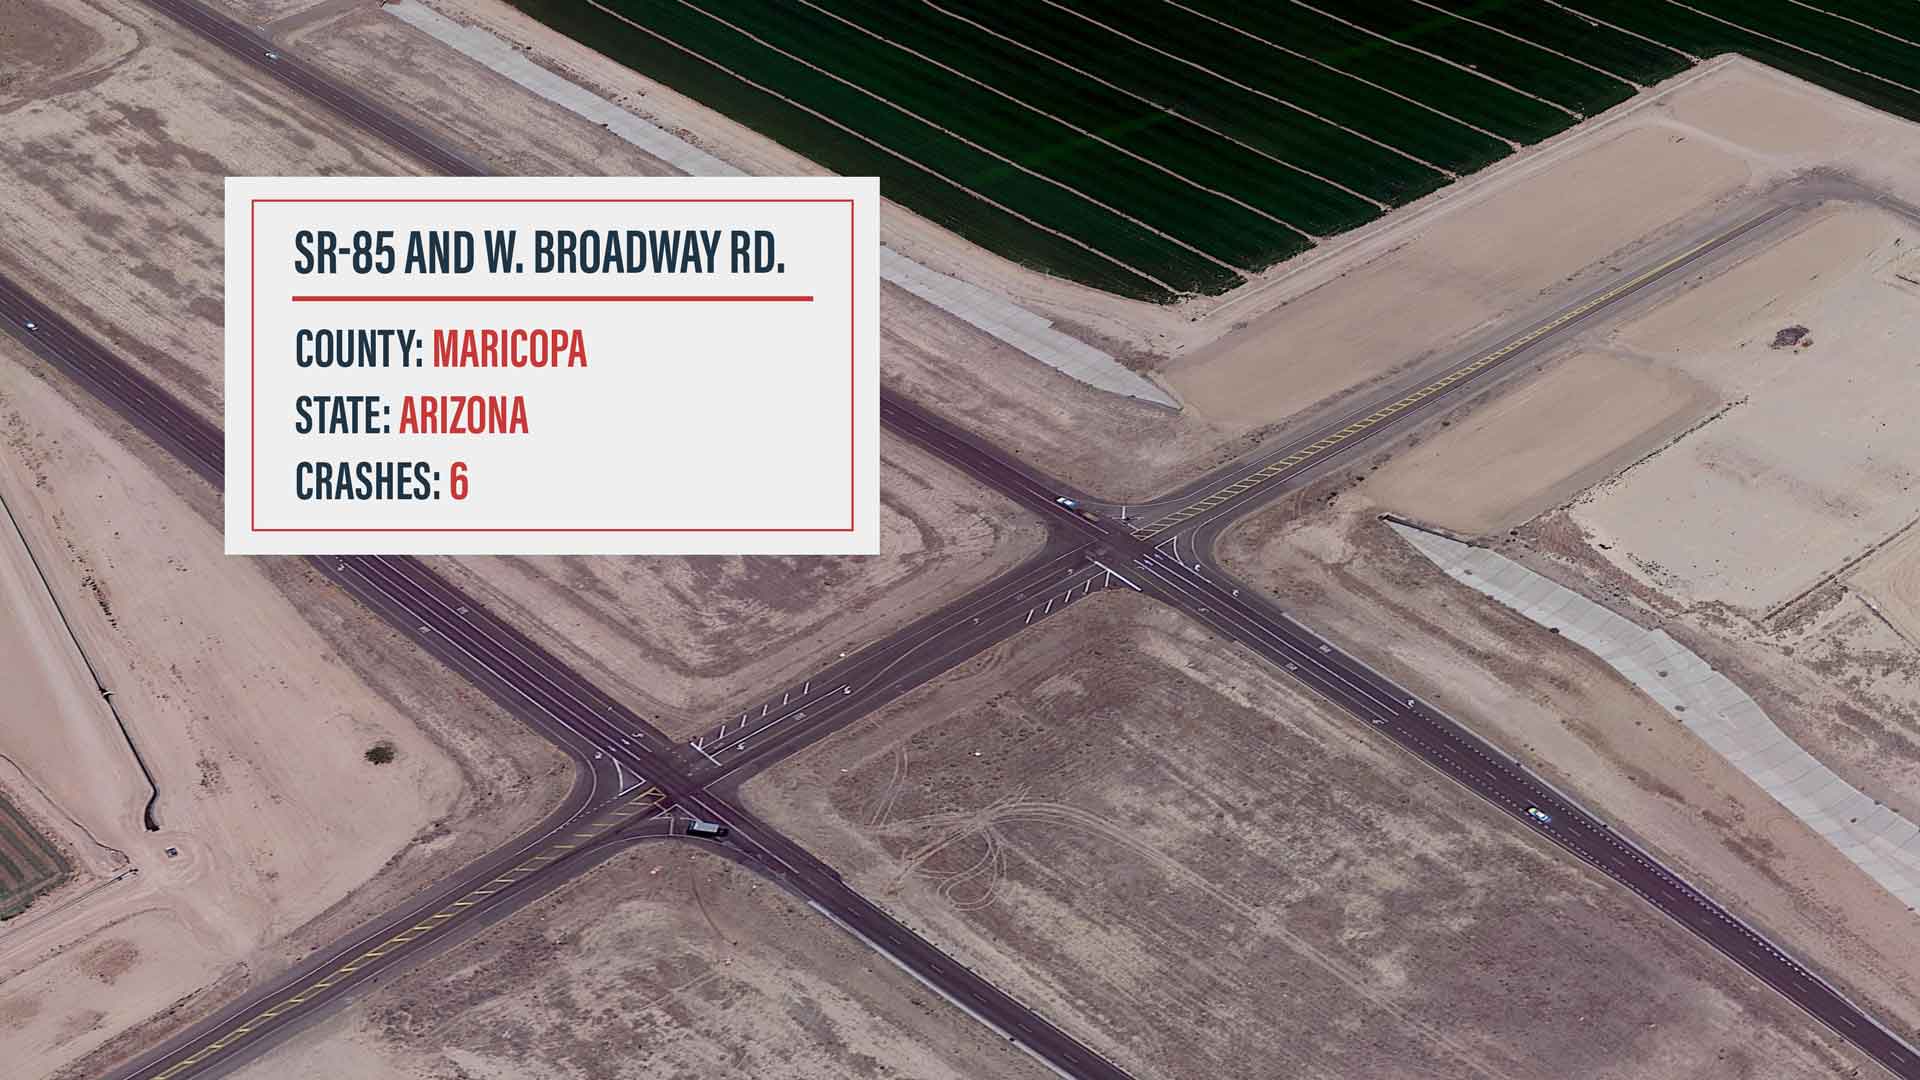
Maricopa County, Arizona
Fatal Crashes: 6
Data for this analysis comes from the National Highway Transit Safety Administration's Fatality Analysis Reporting System. We looked at fatal crashes from 2004 through 2021 (the most recent year for which data has been publicly released as of February 2024), isolating crashes that either happened in an intersection or as a result of driver action in an intersection (turning, etc.)
This story was produced by Piasta Walker Hagenbush LLC and reviewed and distributed by Stacker Media.


